Back Office: Comparison Report
Sign into the Back Office and select a Store.
On the left-side Navigation Panel, click Reports then Comparison Report.
The Comparison Report displays a comparison between two or more (click Compare Time to add more filters, up to a total of 4) selected Time Periods (Compare Time 1, Compare Time 2, etc.) of sales activity.
Select each Time Period, then click Apply.

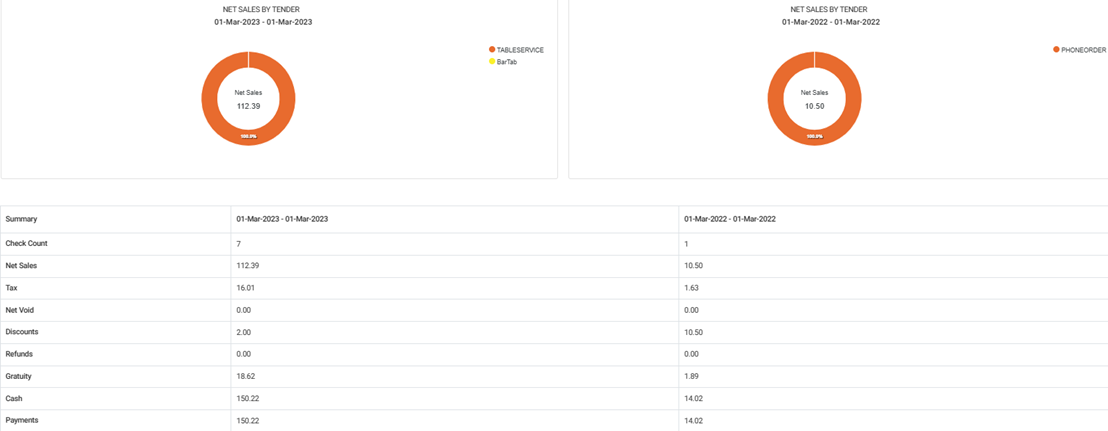
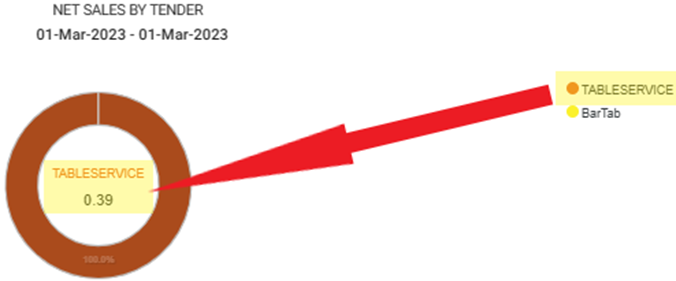
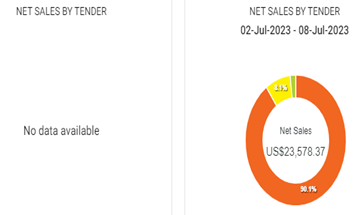
When Apply is clicked, a circular graph representing each selected Compare Time Period’s Net Sales appears, with colorized sections representing the Service Types (QSR, Table Service, To Go, etc.). Mouse over a specific graph section to view its Net Sales and the percentage of the Total Net Sales.
Click a corresponding color and section name caption to replace the Net Sales and amount in the middle with the section information. Click it again to reset to overall Net Sales.
If there is no relevant data available, the message No data available appears.
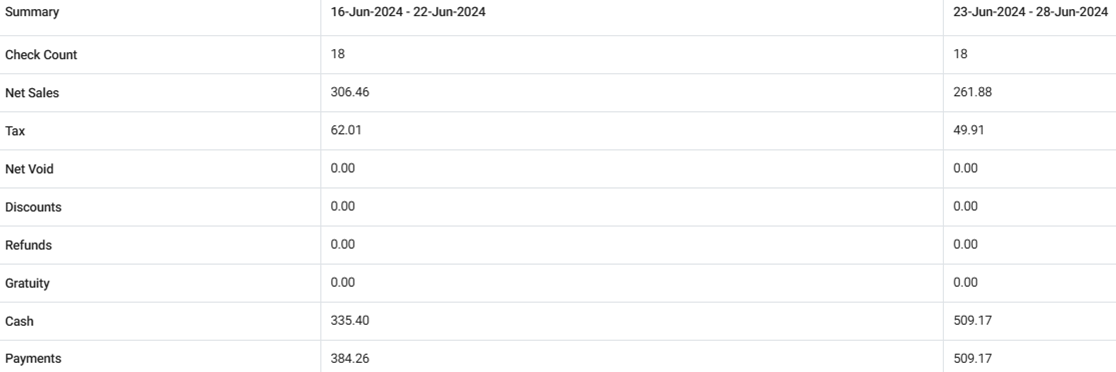
The Summary Table appears below the graphs, with a column representing each Compare Time Period and the following rows:
Check Count: The number of Checks involved during the corresponding Time Period.
Net Sales: The amount of Net Sales generated during the corresponding Time Period.
Tax: The amount in Taxes collected during the corresponding Time Period.
Net Void: The amount in Net Void entered during the corresponding Time Period.
Discounts: The amount in Discounts collected during the corresponding Time Period.
Refunds: The amount in Refunds collected during the corresponding Time Period.
Gratuity: The amount of Gratuity collected during the corresponding Time Period.
Cash: The amount of Cash collected during the corresponding Time Period.
Payments: The total amount in Payments collected during the corresponding Time Period.
Related Articles
Back Office: Comparison Report
Sign into the Back Office and select a Store. On the left-side Navigation Panel, click Reports then Comparison Report. When a Dashboard tab has a Time Period dropdown: Today – The report will run based on Today’s store business date. Yesterday – The ...
Retail Back Office: Comparison Report
Navigation: Sign into the Back Office for your Retail Store, then select Reports > Comparison Report. Comparison Report Displays a comparison between two or more (click Compare Time to add more filters, up to a total of 4) selected Time Periods ...
Back Office: User Role Management
Sign into the Back Office and select a Store. On the left-side Navigation Panel, click User Management then select Roles. On the Roles page, click + New Role at the top-right. The New Role pane appears. You can update a Role by clicking the ...
Retail Back Office: Exchange Reports
Navigation: Log in to the Back Office for your Retail Store, then select Reports > Exchange The Exchange Report page that appears will display Today's data by default, but you can select a Time Period from the dropdown and select any Date(s) if ...
Retail Back Office: User Management - Roles
Navigation: Sign into the Back Office for your Retail Store, then select User Management > Roles The Roles page appears, which displays a table of the currently existing Roles within this Retail Store, with the following columns: Create a New Role or ...