Retail Back Office: Sale Reports
Department
Category
Sub Category
Retail Item
Hourly
Daily
Sale Recap
Cashier Out
Weekly Summary
Sale Summary
Cashier Out
Weekly Summary
Sale Summary
Department
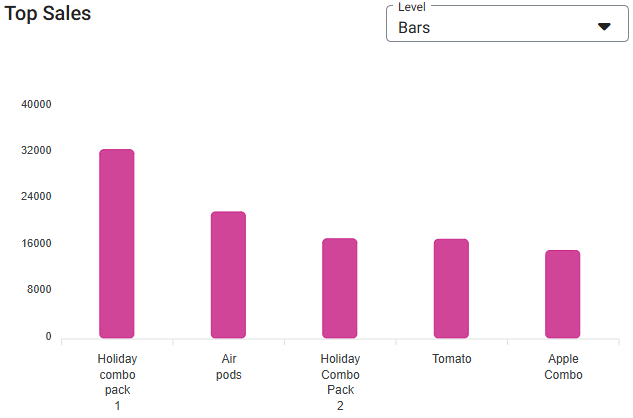
The default tab on the Sales Report screen. It shows data from all Departments by default, with the Top Sales in Graph and Table form, and the Sales By Hour chart.
- Select a Department from the dropdown (created Departments from Product/Items > Departments in alphabetical order).
- The dropdown has a Search option. You can type the name of the Department to identify it more quickly (at least 1 character, with letters and numbers only). If no results are found, the message ‘No results match’ appears.
- Select a Time Period.
- Click Apply. The following data appears:
- Top Sales Graph – View the Top Sales, broken down by Department. You can use the Level dropdown to view it in different forms:
- Bar (Default, screenshot below) – Rectangular bars in descending order.
- Donut – Circular pie graph with pieces of data relative to size.
- The color of the displayed graph is based on the theme selection for the Store.
- At the top of every chart is the Category Sale Percentage ([Department Sale Amount / Total Sale Amount] x 100).
- Mouse over on any Category to view the values based on the Sales along with its Category name, Percentage and Amount.
- Sales By Hour Chart
- The x-axis contains the Department’s Categories involved in sales, along with the Time Period (based on the sale Start and End Times) for those sales. Also, the Legend at the bottom denotes the color line representing each category.
- The y-axis contains the values of Net Sales amounts, with a line for each category.
- This shows the axis point for each and every Time Period along with its Net Sales value.
- Mouse over a point to display the Time along with the Department(s) and Sale Amount(s).
- Table – Displays each Department(s) sales data based on the above selections, with the columns:
- Name – The Department’s Name.
- Sale Amount – The Department’s net sale amount.
- Quantity – The Department’s sale quantity.
- Tax – The Department’s total tax amount.
- Discount – Any amount in Discount applied to the Department's sales.
- % of Sale – The value of the formula = [Sale Amount of Department / Total Sale Amount] * 100.
- Total – The sum of each column’s values.
Category
Displays data from all Categories by default, with the Top Sales in Graph and Table form, and the Sales By Hour chart.
- Select a Category from the dropdown (alphabetical order, created Departments from Product/Items > Category).
- The dropdown has a Search option. Type the name of the Category to identify it more quickly (at least 1 character, with letters and numbers only). If no results are found, the message ‘No results match’ appears.
- Select a Time Period.
- Click Apply. The following data appears:
- Top Sales Graph – View the Top Sales, broken down by Category. It can be viewed as two options via the Level dropdown:
- Bar Graph (Default, screenshot below) – Rectangular bars in descending order.
- Donut Graph – Circular pie graph with pieces of data relative to size.
- The color of the displayed graph is based on the theme selection for the Store.
- At the top of every chart is the Category Sale Percentage ([Category Sale Amount / Total Sale Amount] x 100).
- Mouse over any Category to view the values based on the Sales along with its Category name, Percentage and Amount.
- Sales By Hour Chart
- The x-axis contains the Department’s Categories involved in sales, along with the Time Period (based on the sale Start and End Times) for those sales. Also, the Legend at the bottom denotes the color line representing each category.
- The y-axis contains the values of Net Sales amounts, with a line for each category.
- This shows the axis point for each and every Time Period along with its net sales value.
- Top Sales Table – Displays a Table view of a Categories sales data, with the columns:
- Name – The Category’s Name.
- Sale Amount – The Category’s net sale amount.
- Quantity – The Category’s sale quantity.
- Tax – The Category’s total tax amount.
- Discount – The Category’s discount amount.
- % of Sale – ([Sale Amount of Category / Total Sale Amount] * 100).
- Total – The Total sum amount of each column’s values.
Sub Category
Displays data from all Sub Categories by default, with the Top Sales in Graph and Table form, and the Sales By Hour chart.
- Select a Category and Sub Category (alphabetical order, created from the Product/Items menu). The Sub Category options are based on the Category selection.
- Select a Report Type.
- Default View – The following fields appear: Name, Sale amount, Quantity, Tax, Discount and % of Sale.
- Detailed View – The following fields appear: Seq.No, Name, Unit Price, Quantity, Excludes Tax, Tax, Total Amount, Discount and % of Sale.
- Select a Time Period.
- Click Apply. The following data appears:
- Top Sales – Displays the top-selling items based on your selection.
- The x-axis contains the names of the items.
- The y-axis contains the values of Net Sales amounts.
- Sales By Hour Chart
- The x-axis contains the Department’s Sub Categories involved in sales, along with the Time Period (based on the sale Start and End Times) for those sales. Also, the Legend at the bottom denotes the color line representing each category.
- The y-axis contains the values of Net Sales amounts, with a line for each Sub Category.
- This shows the axis point for each and every Time Period along with its net sales value.
- Top Sales Table – Displays a Table view of a Sub Categories sales data, with the columns:
- Name – The Sub Category’s Name.
- Sale Amount – The Sub Category’s net sale amount.
- Quantity – The Sub Category’s sale quantity.
- Tax – The Sub Category’s total tax amount.
- Discount – The Sub Category’s discount amount.
- % of Sale – ([Sale Amount of Sub Category / Total Sale Amount] * 100).
- Total – The Total sum amount of each column’s values.
Retail Item
Displays data from all Retail Items by default, with the Top Sales in Graph and Table form, and the Sales By Hour chart.
- Select a Department, then the subsequent Category, Sub Category, Retail Item, Price Level, Vendor and Employee.
- The options will have a Search option in each dropdown (alphabetical order, created from the Product/Items page). Type a name to identify it more quickly (at least 1 character, with letters and numbers only). If no results are found, the message ‘No results match’ appears.
- For each dropdown, its options will be dependent upon the selections from the dropdowns to its left. (Example: If the Department is Apparel, then Category is Tops, Sub Category is T Shirts, then Retail Items will be limited to types of T Shirts).
- Select whether to Split By UOM.
- Select the Time Period.
- Click Apply. The following data appears:
- Top Sales – Displays a graph of the top selling items based on the above selections. It can be displayed by Level (Bar or Donut). You can mouse over an item to view its exact Net Sales.
- Sales By Hour - Displays a chart of each item's sales broken down by hours of the day.
- You can mouse over an hour to see the exact item sales.
- Table - Displays a comprehensive breakdown of all selected items sold within the selected Time Period.
- Name – The Retail Item’s name.
- Department – The department the Retail Item belongs to.
- Category – The category the Retail Item belongs to.
- Sub Category – The sub category the Retail Item belongs to.
- Sale Amount – The Retail Item’s net sale amount within the selected Sub Category.
- Quantity – The Retail Item’s quantity of sale within the selected Sub Category.
- Tax – The Retail Item’s total Tax amount within the selected Sub Category.
- Vendor – The vendor who supplied the item.
- Discount – The Retail Item’s Discount amount within the selected Sub Category.
- % of Sale – The Discount Amount’s % of Sale within the selected Sub Category.
- Formula = ([Sale Amount of specific Retail Item / Total Sale Amount] * 100)
- Price Level – The defined Price Level.
- Total – The sum of the Sale Amount, Quantity, Tax, Discount and % of Sale.
Hourly
Displays data by Hourly periods. Select the Time Period, then click Apply.
Top Sales Graph – The top selling items during the selected Time Period.
Sales By Hour - Displays a chart of the top-selling items in Net Sales, broken down by hourly periods
Hourly Table - Displays a Table view of Hourly sales data by Date, with the following columns:
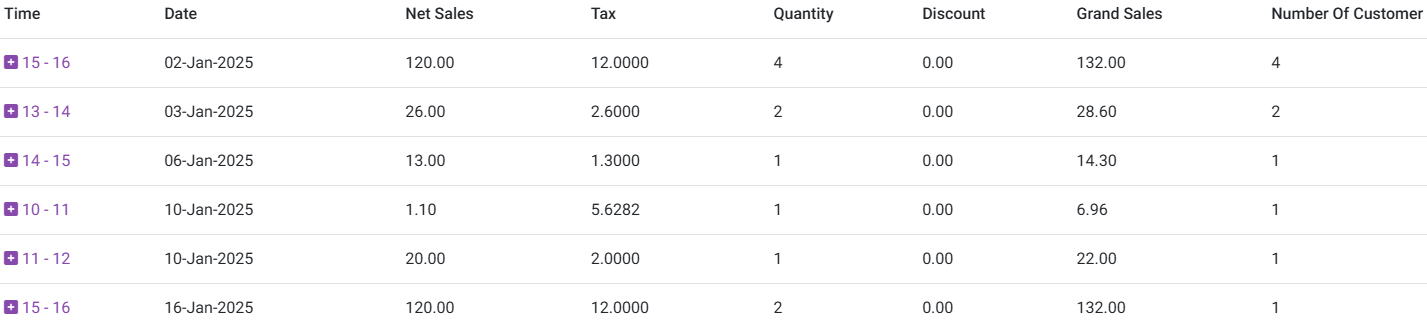
- Time – The hourly period, populated based on the selected Date format in Application settings. When you click on a Time, it will expand to show all the activity that took place during the selected Time Period. The expansion provides the table broken down by Menu Items during that Hourly period.
- Date – A Date during the selected Time Period (the format selected in Application settings).
- Net Sales – The amount of Net Sales (Gross Revenue, minus applicable Sales Returns, Allowance and Discounts) during the Date and for each Item.
- Formula = Gross Sale – Tax – Gross Void (or [Net Void + Void Tax]) – Discount – Discount Tax – Void Discount – Void Discount Tax.
- Tax – The amount of calculated Tax on the Item(s) sold during the Hourly Period.
- Quantity – The amount of Item(s) sold during the Hourly Period.
- Discount – The amount in Discount applied to the Item(s) during the Hourly Period.
- Grand Sales – The amount (Net Sale + Tax) for the Item during the Hourly Period.
- Number of Customer – The number of customer transactions during the Hourly period.
- Total – The Total sum amount of each column’s values.
Daily
Displays Sales data, broken down by Daily periods.
Select the Time Period, then click Apply. The following data appears:
- Top Sales Graph – View the Top Net Sales, broken down by Retail Items.
- Sales By Hour Chart
- The x-axis contains the selected Menu Items involved in sales, along with the Time Period (based on the sale Start and End Times) for those sales. Also, the Legend at the bottom denotes the color line representing each category.
- The y-axis contains the values of Net Sales amounts, with a line for each Menu Item.
- This shows the axis point for each and every Time Period along with its net sales value.
- Table – Displays a Table view of Daily sales data by Date, with the columns:
- Date – A Date during the selected Time Period (the format selected in Application settings).
- Net Sale – Gross Revenue minus applicable Sales Returns, Allowances and Discounts.
- Formula = Gross Sale – Tax – Gross Void (or [Net Void + Void Tax]) – Discount – Discount Tax – Void Discount – Void Discount Tax
- Tax – This will include all the tax amount that are calculated for this particular period
- Discount – The amount in Discount applied to the Item(s).
- Grand Sale – The amount (Net Sale + Tax) for the Item during the Time Period.
- Each Date is clickable and expands to include a table which provides more information on sales that took place for that particular date - including the following columns:
- Receipt No – The transaction’s Receipt Number. Each value is clickable.
- Customer – The name of the customer on the receipt.
- Transaction Date – The Transaction’s Date and Time. (formatting based on Application settings).
- Net Sales – The amount value of the Net Sale.
- Formula = Gross Sale – Tax – Gross Void (or [Net Void + Void Tax]) – Discount – Discount Tax – Void Discount – Void Discount Tax
- Total Tax – The amount of Total Tax.
- Incl Tax – The Inclusive Tax on the Menu Item (if applicable).
- CC Service Charge – The Service Charge on the Credit Card used for the transaction (if applicable).
- Discount – The amount in Discount applied to the Item(s).
- Gross Receipt – Sum of all payments.
- Closed By – The Name of the User who closed the receipt.
- Closed On – The Node by which the receipt was closed.
- Grand Sale – The amount (Net Sale + Tax) for the Item during the Hourly Period.
- Total - Displays the sum of each column from Net Sales to Gross Receipt, and Grand Sale
- Receipt No - Each Receipt No is clickable and expands to include a Receipt Summary, Order Summary, Tax Summary and Payment Summary. Clicking Back reverts to the Date table.
- Additionally, there’s an option to Email a Copy of the Receipt. The Email Address field is available, with just one Email Address per send is available. Click Send Receipt to email the Receipt Details to the entered Address. The Send Receipt option will only be available once a valid Email Address is entered.
- Receipt Summary - Contains a high-level breakdown of the receipt's transaction
- Order Summary – Contains a breakdown of the items on the Order, such as Item, its Price and Qty (Quantity) and Amount (Price x Quantity) - along with a Sub Total for the Amount column (sum of all Amounts).
- Tax Summary – Contains each type of Tax applied to the transaction with their Type, Rate % and Amount - along with a Tax Total for the Amount column (sum of all Taxes applied).
- Payment Summary – Contains all payments made on the transaction with their Payment No, Type, Tip, CC Service Charge, Amount, Status, Auth Code and Transaction No.
Sale Recap
Displays a high-level overview of Sales activity.
- Select the Sale Recap Type. If Time Period was selected, then select the Time Period after the Report Type.
- Select an Employee or All employees (default).
- Select the Report Type (One Page PDF or Detailed Report).
- Date – The first and last Clock-In Dates and Times.
Business Date – The beginning and ending Dates when sales occurred. - Based on your previous selections, the following data may appear:
- Receipt Status – Displays the Receipt Count, Guest Count, Cover Count, Average Per Receipt and Average Per Guest.
- Receipt Count – Total number of Receipts during a selected Time Period. Will be displayed only when the Guest/Receipts toggle is Enabled in Report Settings (under Settings). Receipt Void will not be included.
- Guest Count – Total number of Guests during a selected Time Period. Will be displayed only when the Guest/Receipts toggle is Enabled in Report Settings (under Settings).
- Average Per Receipt – The Average amount ($) per Receipt (Total Amount / Total Receipts).
- Average Per Guest – The Average amount ($) per Guest (Total Amount / Total Guests).
- Sales – The Total Sales for a selected Time Period.
- Gross Sales – The Gross Sales during the selected Time Period.
- Formula = Sum of all Payments + Gross Void + Discount + Discount Tax + Void Discount + Void Discount Tax - (GC Sold + HA Sold + Membership Sold + GiveX Sold + Gratuity + Delivery Compensation)
- Net Sales – The Net Sales (gross revenue minus applicable sales returns, allowances and discounts) during the selected Time Period.
- Formula = Gross sale - Tax - Gross Void (or Net Void + Void tax)-Discount - Discount tax - Void discount - Void discount tax.
- Non-Taxable Net Sales – The Non-Taxable Net Sales during the selected Time Period.Non-Taxable Net Sales are any menu item which has zero ($0.00) amount.
- Grand Sales – The Grand Sales during the selected Time Period. Formula = Net Sale + Tax.
- Grand Sales will only display when the Grand Sale toggle in Settings > Report Settings > Sale Recap (Sale - Grand Sale) is Enabled.
- Gross Receipt – The Gross Receipt during the selected Time Period. Formula = Sum of all Payments.
- Gross Receipt will only display when the Grand Sale toggle in Settings > Report Settings > Sale Recap (Sale - Gross Receipt), is Enabled.
- Gross Void – The Gross Void during the selected Time Period (including Tax).
- Gross Void will only display when the Grand Void toggle in Settings > Report Settings > Sale Recap (Sale - Gross Void), is Enabled.
- Formula = Total price (menu item price + tax) menu item and modifier which are voided.
- Net Void – The Net Void during the selected Time Period (excluding Tax).
- Net Void will only display when the Net Void toggle in Settings > Report Settings > Sale Recap (Sale - Net Void), is Enabled.
- Formula = Total price (menu item price) menu item and modifier which are voided.
- Taxes – Displays all the Taxes that were collected during the selected Time Period. Below the Total Tax Collected line, the Rounding Off amount is displayed for just the Amount column.
- Tax Name – The Name of the Tax.
- If the Tax Split-Up toggle in Settings > Report Settings > Sale Recap (Taxes - Tax Split-Up) is Enabled, only then will the Tax Split-Up (Name, %, Net Sales, Amount and Tax Exempt) be displayed on the Sale Recap Report. If Disabled, then all the Taxes are displayed on a single line along with the calculations in Sale Recap Report. Only Rounding Off and Tax Exempt would be displayed.
- % – The calculated Tax Percentage.
- Net Sales – The Net Sales for the Tax.
- If the Tax With Net Sales toggle in Settings > Report Settings > Sale Recap (Taxes – Tax With Net Sales) is enabled, only then will Net Sales be displayed in this report.
- Amount – The Amount of Tax.
- Tax Exempt – The Amount of Tax Exempt value.
- By default, Refund Tax is displayed. If the Tax-Exempt toggle Settings > Report Settings > Sale Recap (Taxes - Tax Split-Up), only then will the Refund Tax be displayed in the Sale Recap report.
- Credit Card – All Credit Card transactions that took place during the selected Time Period.
- If CC Split Up is enabled in the Sale Recap Report settings then these columns will be displayed in Reports i.e., Count, Amt, Tip and SC. If disabled, then in Payment Summary section the Credit Card line item along with its Amount (Amt) will be displayed.
- Columns include Count, Amt, Tip and SC - along with the Deposit column available on an Admin screen (when the Show Cash Reward toggle is Enabled).
- The Total is available for all columns.
- Other Payment – Remaining payments from transactions other than Credit Cards.
- When Other Payemnt Split-Up in Sale Recap Report settings is Enabled, you can view the columns such as HA Payments, GiveX, Loyalty, Cash, Gift Card, Online Payment, and Others. If Disabled, then just the Credit Card and its Amount will be displayed.
- The Total will be available at the bottom.
- Future Order – Displays the following items:
- Advance Payment in Cash – The amount received prior to the delivery order date.
- Advance Payment in CC – The amount received via cash advance by using a Credit Card.
- Payment Completed – Overall amount of payment from completed orders.
- Past Order Advance Payment – Displays 0.00 if no value is present for the above 3.
- Non-Sale Revenue – Displays revenue from Gift Cards, House Account, Delivery Charge, Membership, Gratuity, and Online Order Service Charges along with the Total amount.
- The Delivery Charge includes Driver Compensation and Store Compensation, and Delivery Compensation is clickable.
- At least one field should have a value of greater than 0 and will be displayed here.
- Tip/Gratuity – This includes the Tip amount received from all the payments such as Credit Card, Employee Tip, Tip Charge, Gift Card, HA Payment, GiveX, Gratuity, Employee Gratuity, Employer Gratuity, Membership Tip, Online Tip (should be clickable and includes Delivery Tip and Pickup Tip) along with Total.
- Discount – Displays the Receipt Discount, Item Discount and its Total followed by Discount Tax, Void Discount, Void Discount Tax, Cash Reward and Discount in Gift Card.
- Refund – Displays Refunds that have occurred during the selected Time Period. This includes Cash Refund, Non cash Refund and Refund Tax along with its Total. When the values are above zero, they are displayed in the report (Refund section).
- Summary – Displays Opening Balance, Paid In, Paid Out, Tip Paid Out, Cash Drop, Cash Expected and Over/Shortage, including negative values if applicable.
- Department Summary – Displays the amount of sales for each Department, with the Total at the bottom. This will display only if the Department Summary toggle in Settings > Sale Recap Report > Other Summaries is Enabled (Yes).
- Category Summary – Displays the amount of sales for each Category, with the Total at the bottom. This will display only if the Category Summary toggle in Settings > Sale Recap Report > Other Summaries is Enabled (Yes).
- Hourly Summary – Displays the amount of sales for each Hour of the day, with the Total at the bottom. This will display only if the Hourly Summary toggle in Settings > Sale Recap Report > Other Summaries is Enabled (Yes).
- Formula Definition – The formulas Cash Expected and Overage / Shortage can be customized.
- Cash Expected: Formula = Opening Balance + Cash Amount + Paid In - (Paid Out + Tip + Gratuity + Delivery Compensation + Cash Drop + Cash Refund + Driver Tip).
- Cash Expected - Add: Disabled by default. If Enabled, you can view the Opening Balance, Cash Amount and Paid In fields.
- Cash Expected - Subtract: Disabled by default. If Enabled, you can view the Paid Out, Cash Drop, Delivery Charge, Cash Refund, Driver Tip, and Tip Paid Out fields.
- Overage / Shortage: Formula = Closing Balance - Cash Expected
- Overage / Shortage - Add: Disabled by default. If Enabled, you can view the Paid Out, Cash Drop, Closing Balance, Delivery Charge, Cash Refund, Driver Tip, and Tip Paid Out fields.
- Overage / Shortage - Subtract: Disabled by default. If Enabled, you can view the Opening Balance, Cash Amount and Paid In fields.
- For each field, the Close option is available. If you select any field in Add then the same field will be greyed out for Subtract, and vice versa. You cannot select the field which is already selected in the same section.
- Summary – Displays the Balance with Paid In/Out, Cash and any Overage/Shortage.
- Opening Balance – The Opening Balance during the selected Time Period. It is displayed only when the Opening Balance toggle in Settings > Sales Recap Report > Summary is Enabled.
- Paid In & Paid Out – The amounts Paid In and Out during the selected Time Period. They are displayed only when the Paid In/Out toggle in Settings > Sales Recap Report > Summary is Enabled.
- Cash Drop – The amount in Cash Drop during the selected Time Period. It is displayed only when the Cash Drop toggle in Settings > Sales Recap Report > Summary is Enabled.
- Cash Expected – The amount in Cash Expected during the selected Time Period. It is displayed only when the Cash Expected toggle in Settings > Sales Recap Report > Summary is Enabled.
- Over / Shortage – The amount Over and Shortage during the selected Time Period. It is displayed only when the Over / Shortage toggle in Settings > Sales Recap Report > Summary is Enabled.
- User Defined – The name is displayed based on the user defined one in the sale Recap Report (for payment Mode).
- System Defined – The name is displayed based on the system defined one in the sale Recap Report (for payment Mode).
Cashier Out
Displays the Cashier Driver App Report, and appears if the Cashier Report for Driver toggle, under Settings > Application > Delivery at the bottom of the page, is set to Enabled (Yes). The Driver Closed Sales record will be displayed for this driver in Cashier Out Report.
- Select the following, along with Time Period.
- Employee – Select from an Employee created under User Management (in alphabetical order).
- Utilize the Search option to find an employee more easily.
Report Type – Select One Page PDF or Detailed Report.
Click Apply. The following data appears:
- Receipt Status – Displays high-level data of receipts.
- Receipt Count – The total amount of Receipts during the selected Time Period, displayed only when the Guest/Receipts toggle in Settings > Reports > Sales Recap Report is Enabled (YES). Receipt Void will not be included.
- Guest Count – The total amount of Guests during the selected Time Period, displayed only when the Guest/Receipts toggle in Settings > Reports > Sales Recap Report is Enabled (YES).
- Cover Count – Based on the Category, Sub Category or Item, displayed only when the Cover toggle in Settings > Reports > Sales Recap Report is Enabled (Yes).
- Average Per Receipt – The Average amount (Total Amount / Total Receipts) per Receipt in currency.
- Average Per Guest – The Average amount (Total Amount / Total Guests) per Receipt in currency.
- Sales – The total amount of Sales during the selected Time Period, broken down by Gross, Net and Non-Taxable Net.
- Gross Sales – The total amount of Gross Sales during the selected Time Period.
- Formula = Sum of all payments + Gross Void + Discount + Discount Tax + Void Discount + Void Discount - (GC Sold + HA Sold + Membership Sold + GiveX Sold + Gratuity + Delivery Compensation)
- Net Sales – The total amount of Net Sales during the selected Time Period.
- Formula = Gross Sale - Tax - Gross Void (or Net Void +Void Tax) - Discount - Discount Tax - Void Discount - Void Discount Tax.
- Non-Taxable Net Sales – The total amount of Non-Taxable Net Sales during the selected Time Period.
- Non-Taxable Net Sales are any menu item which has zero ($0.00) amount.
- Grand Sales – The total amount of Grand Sales during the selected Time Period, and will display only when the Grand Sales toggle in Settings > Reports > Sales Recap Report > Sales is Enabled (Yes).
- Formula = Net Sale + Tax.
- Gross Receipt – The Gross Receipt during the selected Time Period, and will display only when the Gross Receipt toggle in Settings > Reports > Sales Recap Report > Sales is Enabled (Yes).
- Formula: Sum Total of all payments.
- Gross Void – The Gross Void (tax included) during the selected Time Period, and will display only when the Gross Void toggle in Settings > Reports > Sales Recap Report > Sales is Enabled (Yes).
- Formula: Total Price (Menu Item Price + Tax) Menu Item and Modifier which are voided.
- Net Void – The Net Void (tax excluded) during the selected Time Period, and will display only when the Net Void toggle in Settings > Reports > Sales Recap Report > Sales is Enabled (Yes).
- Formula: Total Price (Menu Item Price) Menu Item and Modifier which are voided.
- Tax – The total amount of Tax collected during the selected Time Period.
- Tax Exempt – The tax exempt amount during the selected Time Period.
- Item Service Charge – The Item Service Charge for the selected Time Period.
- Taxes – Displays all collected Taxes collected during the selected Time Period. Includes columns for Tax Name, %, Net Sales, Amount and Tax Exempt, but only if the Tax Split Up toggle in Settings > Report Settings > Sale Recap Report > Taxes is Enabled (Yes), then only Rounding Off and Tax Exempt will be displayed.
- Name – The Name of the Tax
- % – The calculated percentage taken for the Tax.
- Net Sales – The amount of Net Sales based on the Tax, and is only displayed when the Tax with Net Sales toggle in Settings > Reports > Sales Recap Report > Taxes is Enabled (Yes).
- Amount – The amount of Tax collected.
- Tax Exempt – The amount that’s exempt from Taxes, and is only displayed when the Tax with Net Sales toggle in Settings > Reports > Sales Recap Report > Taxes is Enabled (Yes).
- Refund Tax is displayed by default.
Total Tax Collected appears for Amount and Tax Exempt, with Rounding Off having a value just for Amount.- Credit Card – Displays all credit card transactions during the selected Time Period.
- It includes columns for Count, Amt (Amount), SC and Deposit which are only displayed when the CC Split Up toggle in Settings > Reports > Sales Recap Report > Payments is Enabled (Yes).
- The Deposit column is available in the Admin view which is only displayed when the Show Cash Reward toggle is Enabled.
- The Total is displayed for all available columns.
- Other Payment – Displays remaining transaction payments other than Credit Card.
- It includes fields for HA Payments, GiveX, Loyalty, Cash, Gift Card, Online Payment, and Others which are only displayed when the Payment Split Up toggle is Enabled (Yes).
- The Total is displayed for all available columns.
- Payment Summary – Displays a summary for Credit Card, SideCC and Other Payments (all 3 by default) along with the Total.
- Future Order – Displays financial data based on Future Order activity. The fields Advance Payment in Cash, Advance Payment in CC, Payment Completed and Past Order Advance Payment are displayed by default.
- Advance Payment in Cash – The amount received prior to the delivery order date.
- Advance Payment in CC – The amount in cash advance via Credit Card.
- Payment Completed – Overall payment completed orders.
- Past Order Advance Payment – If there’s no values for the above line items, 0.00 is displayed.
- Non-Sale Revenue – Displays revenue generated from non-traditional sales, including Gift Card Sold / Recharge, House Account Sold / Recharge, Delivery Charge Cost, Membership Sold / Recharge, Gratuity and Online Order Service Charge along with the Total.
- The Delivery Charge includes Driver Compensation and Store Compensation, and Delivery Compensation should be clickable.
- At least one field should have the value of more than 0.00 and is displayed.
- Discount – Includes the Receipt Discount, Item Discount and its Total followed by Discount Tax, Void Discount, Void Discount Tax, Cash Reward and Discount in Gift Card is displayed.
- Refund – Displays the refunds that have taken place during the selected Time Period. This includes Cash Refund, Non cash Refund and Refund Tax along with the Total. This section will be displayed only when values are above zero (0.00).
- Department Summary – Displays the amount of sales for each Department, with the Total at the bottom. This will display only if the Department Summary toggle in Settings > Sale Recap Report > Other Summaries is Enabled (Yes).
- Category Summary – Displays the amount of sales for each Category, with the Total at the bottom. This will display only if the Category Summary toggle in Settings > Sale Recap Report > Other Summaries is Enabled (Yes).
- Hourly Summary – Displays the amount of sales for each Hour of the day, with the Total at the bottom. This will display only if the Hourly Summary toggle in Settings > Sale Recap Report > Other Summaries is Enabled (Yes).
- Formula Definition – Formulas for Cash Expected and Overage / Shortage can be customized.
- Cash Expected: Formula = Opening Balance + Cash Amount + Paid In - (Paid Out + Tip + Gratuity + Delivery Compensation + Cash Drop + Cash Refund + Driver Tip).
- Cash Expected - Add: Disabled by default. If Enabled, you can view the Opening Balance, Cash Amount and Paid In fields.
- Cash Expected - Subtract: Disabled by default. If Enabled, you can view the Paid Out, Cash Drop, Delivery Charge, Cash Refund, Driver Tip, and Tip Paid Out fields.
- For each field, the Close option is available. If you select any field in Add then the same field will be greyed out for Subtract, and vice versa. You cannot select the field which is already selected in the same section.
- Overage / Shortage: Formula = Closing Balance - Cash Expected
- Overage / Shortage - Add: Disabled by default. If Enabled, you can view the Paid Out, Cash Drop, Closing Balance, Delivery Charge, Cash Refund, Driver Tip, and Tip Paid Out fields.
- Overage / Shortage - Subtract: Disabled by default. If Enabled, you can view the Opening Balance, Cash Amount and Paid In fields.
- For each field, the Close option is available. If you select any field in Add then the same field will be greyed out for Subtract, and vice versa. You cannot select the field which is already selected in the same section.
- Summary – Displays the Balance with Paid In/Out, Cash and any Overage/Shortage.
- Opening Balance – The Opening Balance during the selected Time Period. It is displayed only when the Opening Balance toggle in Settings > Sales Recap Report > Summary is Enabled.
- Paid In & Paid Out – The amounts Paid In and Out during the selected Time Period. They are displayed only when the Paid In/Out toggle in Settings > Sales Recap Report > Summary is Enabled.
- Cash Drop – The amount in Cash Drop during the selected Time Period. It is displayed only when the Cash Drop toggle in Settings > Sales Recap Report > Summary is Enabled.
- Cash Expected – The amount in Cash Expected during the selected Time Period. It is displayed only when the Cash Expected toggle in Settings > Sales Recap Report > Summary is Enabled.
- Over / Shortage – The amount Over and Shortage during the selected Time Period. It is displayed only when the Over / Shortage toggle in Settings > Sales Recap Report > Summary is Enabled.
Weekly Summary
Select the Time Period (defaults to This week), then click Apply. When you run the Weekly Summary report, you’re able to view the table.
- Summary – Displays the various types of sales that occurred during the selected week. Includes values for fields such as Net Void, Gross Receipt, Gross Sales, Net Sales, Gross Void, Grand Sales.
- Days of a Week – This filter is displayed based on the selected Time Period.
- Total – The Total amount of sales for that particular day.
- Payment Section – Displays the various types of payment methods that were utilized during the selected week – such as US Dollar, Online Payment, Cash, Online Payment (T), Visa (T), Cash, All Credit Cards (configured name(s) will be displayed).
- Tax Section – Displays the amount in taxes collected during the selected week. Includes values for Total Tax Collected, Tax Exempted and Rounding Off.
- Discount – Displays the amount in Discounts applied during the selected week. Includes values for Discount Tax, Discounts, Void Discount Tax and Void Discounts.
- Summary – Includes values for Over Shortage, Cover, Paid In, Paid Out, Tip Total, Cash Drop, Cash Expected, Loyalty, Opening Balance, COGS, and Factor4 Sold Amount.
- Other Payment – Includes values for Driver Tip, Cash Refunds and Non-Cash Refunds.
- Non-Sale Revenue – Includes revenue aside from traditional sales during the selected Time Period. Includes values for Gift Card Sold/Recharge, House Account Sold/Recharge, Delivery Charge Cost, Membership Sold/Recharge, Gratuity and Online Order Service Charge.
Sale Summary
Select from the following fields, along with Time Period.
- Employee– View all Employees created in User Management (sorted alphabetically), and select an Employee from the dropdown.
- Click Apply. The table is populated with data in the following columns, with a Total at the bottom for monetary values:
- Receipt – Displays the Receipt Number as a clickable link which displays the Receipt No screen (see below).
- Customer – The name of the Customer
- Transaction Date – The date to which the transaction occurs along with time will appear based on the Date Format and Time Format in Application Settings.
- = Gross Receipt – Tax – Non Sale Total
or
= Gross Sale – Tax – Void – Discounts – Discount Tax – Void Discount – Void Discount Tax - Total Tax – All Taxes (except inclusive tax) applied to the Receipt.
- Incl. Tax – Just the Inclusive Tax (not included in Total Tax).
- CC Service Charge – Any applicable Service Charge when a Credit Card is used.
- Discount – Any amount in Discount(s) applied to the Receipt.
- Gross Receipt – Sum of all payments applied to the Receipt.
- Closed By – The user who closed this Receipt.
- Closed On – The Node where the Receipt was closed.
- Receipt Number – The Receipt No page displays sections for Receipt Summary, Order Summary, Tax Summary and Payment Summary. Click Back to revert to the main Sale Summary table view.
- Receipt Summary – Displays an overview of the Receipt for the transaction.
- Order Summary – Displays Order items (including Modifiers), Price, Qty and Amount along with Sub Total.
- Tax Summary – Displays a Summary of the Taxes collected during the selected Time Period, with columns for Type, Rate % and Amount which has a Tax Total.
Payment Summary – Displays a Summary of the Payments during the selected Time Period, with columns for Payment No, Type, Tip, CC Service Charge, Amount, Status, Auth Code and Transaction No.
Cashier Out
Displays the Cashier Driver App Report, and appears if the Cashier Report for Driver toggle, under Settings > Application > Delivery at the bottom of the page, is set to Enabled (Yes). The Driver Closed Sales record will be displayed for this driver in Cashier Out Report.
- Select the following, along with Time Period.
- Employee – Select from an Employee created under User Management (in alphabetical order).
- Utilize the Search option to find an employee more easily.
Report Type – Select One Page PDF or Detailed Report.
Click Apply. The following data appears:
- Receipt Status – Displays high-level data of receipts.
- Receipt Count – The total amount of Receipts during the selected Time Period, displayed only when the Guest/Receipts toggle in Settings > Reports > Sales Recap Report is Enabled (YES). Receipt Void will not be included.
- Guest Count – The total amount of Guests during the selected Time Period, displayed only when the Guest/Receipts toggle in Settings > Reports > Sales Recap Report is Enabled (YES).
- Cover Count – Based on the Category, Sub Category or Item, displayed only when the Cover toggle in Settings > Reports > Sales Recap Report is Enabled (Yes).
- Average Per Receipt – The Average amount (Total Amount / Total Receipts) per Receipt in currency.
- Average Per Guest – The Average amount (Total Amount / Total Guests) per Receipt in currency.
- Sales – The total amount of Sales during the selected Time Period, broken down by Gross, Net and Non-Taxable Net.
- Gross Sales – The total amount of Gross Sales during the selected Time Period.
- Formula = Sum of all payments + Gross Void + Discount + Discount Tax + Void Discount + Void Discount - (GC Sold + HA Sold + Membership Sold + GiveX Sold + Gratuity + Delivery Compensation)
- Net Sales – The total amount of Net Sales during the selected Time Period.
- Formula = Gross Sale - Tax - Gross Void (or Net Void +Void Tax) - Discount - Discount Tax - Void Discount - Void Discount Tax.
- Non-Taxable Net Sales – The total amount of Non-Taxable Net Sales during the selected Time Period.
- Non-Taxable Net Sales are any menu item which has zero ($0.00) amount.
- Grand Sales – The total amount of Grand Sales during the selected Time Period, and will display only when the Grand Sales toggle in Settings > Reports > Sales Recap Report > Sales is Enabled (Yes).
- Formula = Net Sale + Tax.
- Gross Receipt – The Gross Receipt during the selected Time Period, and will display only when the Gross Receipt toggle in Settings > Reports > Sales Recap Report > Sales is Enabled (Yes).
- Formula: Sum Total of all payments.
- Gross Void – The Gross Void (tax included) during the selected Time Period, and will display only when the Gross Void toggle in Settings > Reports > Sales Recap Report > Sales is Enabled (Yes).
- Formula: Total Price (Menu Item Price + Tax) Menu Item and Modifier which are voided.
- Net Void – The Net Void (tax excluded) during the selected Time Period, and will display only when the Net Void toggle in Settings > Reports > Sales Recap Report > Sales is Enabled (Yes).
- Formula: Total Price (Menu Item Price) Menu Item and Modifier which are voided.
- Tax – The total amount of Tax collected during the selected Time Period.
- Tax Exempt – The tax exempt amount during the selected Time Period.
- Item Service Charge – The Item Service Charge for the selected Time Period.
- Taxes – Displays all collected Taxes collected during the selected Time Period. Includes columns for Tax Name, %, Net Sales, Amount and Tax Exempt, but only if the Tax Split Up toggle in Settings > Report Settings > Sale Recap Report > Taxes is Enabled (Yes), then only Rounding Off and Tax Exempt will be displayed.
- Name – The Name of the Tax
- % – The calculated percentage taken for the Tax.
- Net Sales – The amount of Net Sales based on the Tax, and is only displayed when the Tax with Net Sales toggle in Settings > Reports > Sales Recap Report > Taxes is Enabled (Yes).
- Amount – The amount of Tax collected.
- Tax Exempt – The amount that’s exempt from Taxes, and is only displayed when the Tax with Net Sales toggle in Settings > Reports > Sales Recap Report > Taxes is Enabled (Yes).
- Refund Tax is displayed by default.
Total Tax Collected appears for Amount and Tax Exempt, with Rounding Off having a value just for Amount.- Credit Card – Displays all credit card transactions during the selected Time Period.
- It includes columns for Count, Amt (Amount), SC and Deposit which are only displayed when the CC Split Up toggle in Settings > Reports > Sales Recap Report > Payments is Enabled (Yes).
- The Deposit column is available in the Admin view which is only displayed when the Show Cash Reward toggle is Enabled.
- The Total is displayed for all available columns.
- Other Payment – Displays remaining transaction payments other than Credit Card.
- It includes fields for HA Payments, GiveX, Loyalty, Cash, Gift Card, Online Payment, and Others which are only displayed when the Payment Split Up toggle is Enabled (Yes).
- The Total is displayed for all available columns.
- Payment Summary – Displays a summary for Credit Card, SideCC and Other Payments (all 3 by default) along with the Total.
- Future Order – Displays financial data based on Future Order activity. The fields Advance Payment in Cash, Advance Payment in CC, Payment Completed and Past Order Advance Payment are displayed by default.
- Advance Payment in Cash – The amount received prior to the delivery order date.
- Advance Payment in CC – The amount in cash advance via Credit Card.
- Payment Completed – Overall payment completed orders.
- Past Order Advance Payment – If there’s no values for the above line items, 0.00 is displayed.
- Non-Sale Revenue – Displays revenue generated from non-traditional sales, including Gift Card Sold / Recharge, House Account Sold / Recharge, Delivery Charge Cost, Membership Sold / Recharge, Gratuity and Online Order Service Charge along with the Total.
- The Delivery Charge includes Driver Compensation and Store Compensation, and Delivery Compensation should be clickable.
- At least one field should have the value of more than 0.00 and is displayed.
- Discount – Includes the Receipt Discount, Item Discount and its Total followed by Discount Tax, Void Discount, Void Discount Tax, Cash Reward and Discount in Gift Card is displayed.
- Refund – Displays the refunds that have taken place during the selected Time Period. This includes Cash Refund, Non cash Refund and Refund Tax along with the Total. This section will be displayed only when values are above zero (0.00).
- Department Summary – Displays the amount of sales for each Department, with the Total at the bottom. This will display only if the Department Summary toggle in Settings > Sale Recap Report > Other Summaries is Enabled (Yes).
- Category Summary – Displays the amount of sales for each Category, with the Total at the bottom. This will display only if the Category Summary toggle in Settings > Sale Recap Report > Other Summaries is Enabled (Yes).
- Hourly Summary – Displays the amount of sales for each Hour of the day, with the Total at the bottom. This will display only if the Hourly Summary toggle in Settings > Sale Recap Report > Other Summaries is Enabled (Yes).
- Formula Definition – Formulas for Cash Expected and Overage / Shortage can be customized.
- Cash Expected: Formula = Opening Balance + Cash Amount + Paid In - (Paid Out + Tip + Gratuity + Delivery Compensation + Cash Drop + Cash Refund + Driver Tip).
- Cash Expected - Add: Disabled by default. If Enabled, you can view the Opening Balance, Cash Amount and Paid In fields.
- Cash Expected - Subtract: Disabled by default. If Enabled, you can view the Paid Out, Cash Drop, Delivery Charge, Cash Refund, Driver Tip, and Tip Paid Out fields.
- For each field, the Close option is available. If you select any field in Add then the same field will be greyed out for Subtract, and vice versa. You cannot select the field which is already selected in the same section.
- Overage / Shortage: Formula = Closing Balance - Cash Expected
- Overage / Shortage - Add: Disabled by default. If Enabled, you can view the Paid Out, Cash Drop, Closing Balance, Delivery Charge, Cash Refund, Driver Tip, and Tip Paid Out fields.
- Overage / Shortage - Subtract: Disabled by default. If Enabled, you can view the Opening Balance, Cash Amount and Paid In fields.
- For each field, the Close option is available. If you select any field in Add then the same field will be greyed out for Subtract, and vice versa. You cannot select the field which is already selected in the same section.
- Summary – Displays the Balance with Paid In/Out, Cash and any Overage/Shortage.
- Opening Balance – The Opening Balance during the selected Time Period. It is displayed only when the Opening Balance toggle in Settings > Sales Recap Report > Summary is Enabled.
- Paid In & Paid Out – The amounts Paid In and Out during the selected Time Period. They are displayed only when the Paid In/Out toggle in Settings > Sales Recap Report > Summary is Enabled.
- Cash Drop – The amount in Cash Drop during the selected Time Period. It is displayed only when the Cash Drop toggle in Settings > Sales Recap Report > Summary is Enabled.
- Cash Expected – The amount in Cash Expected during the selected Time Period. It is displayed only when the Cash Expected toggle in Settings > Sales Recap Report > Summary is Enabled.
- Over / Shortage – The amount Over and Shortage during the selected Time Period. It is displayed only when the Over / Shortage toggle in Settings > Sales Recap Report > Summary is Enabled.
Weekly Summary
Select the Time Period (defaults to This week), then click Apply. When you run the Weekly Summary report, you’re able to view the table.
- Summary – Displays the various types of sales that occurred during the selected week. Includes values for fields such as Net Void, Gross Receipt, Gross Sales, Net Sales, Gross Void, Grand Sales.
- Days of a Week – This filter is displayed based on the selected Time Period.
- Total – The Total amount of sales for that particular day.
- Payment Section – Displays the various types of payment methods that were utilized during the selected week – such as US Dollar, Online Payment, Cash, Online Payment (T), Visa (T), Cash, All Credit Cards (configured name(s) will be displayed).
- Tax Section – Displays the amount in taxes collected during the selected week. Includes values for Total Tax Collected, Tax Exempted and Rounding Off.
- Discount – Displays the amount in Discounts applied during the selected week. Includes values for Discount Tax, Discounts, Void Discount Tax and Void Discounts.
- Summary – Includes values for Over Shortage, Cover, Paid In, Paid Out, Tip Total, Cash Drop, Cash Expected, Loyalty, Opening Balance, COGS, and Factor4 Sold Amount.
- Other Payment – Includes values for Driver Tip, Cash Refunds and Non-Cash Refunds.
- Non-Sale Revenue – Includes revenue aside from traditional sales during the selected Time Period. Includes values for Gift Card Sold/Recharge, House Account Sold/Recharge, Delivery Charge Cost, Membership Sold/Recharge, Gratuity and Online Order Service Charge.
Sale Summary
Select from the following fields, along with Time Period.
- Employee– View all Employees created in User Management (sorted alphabetically), and select an Employee from the dropdown.
- Click Apply. The table is populated with data in the following columns, with a Total at the bottom for monetary values:
- Receipt – Displays the Receipt Number as a clickable link which displays the Receipt No screen (see below).
- Customer – The name of the Customer
- Transaction Date – The date to which the transaction occurs along with time will appear based on the Date Format and Time Format in Application Settings.
- = Gross Receipt – Tax – Non Sale Total
or
= Gross Sale – Tax – Void – Discounts – Discount Tax – Void Discount – Void Discount Tax - Total Tax – All Taxes (except inclusive tax) applied to the Receipt.
- Incl. Tax – Just the Inclusive Tax (not included in Total Tax).
- CC Service Charge – Any applicable Service Charge when a Credit Card is used.
- Discount – Any amount in Discount(s) applied to the Receipt.
- Gross Receipt – Sum of all payments applied to the Receipt.
- Closed By – The user who closed this Receipt.
- Closed On – The Node where the Receipt was closed.
- Receipt Number – The Receipt No page displays sections for Receipt Summary, Order Summary, Tax Summary and Payment Summary. Click Back to revert to the main Sale Summary table view.
- Receipt Summary – Displays an overview of the Receipt for the transaction.
- Order Summary – Displays Order items (including Modifiers), Price, Qty and Amount along with Sub Total.
- Tax Summary – Displays a Summary of the Taxes collected during the selected Time Period, with columns for Type, Rate % and Amount which has a Tax Total.
- Payment Summary – Displays a Summary of the Payments during the selected Time Period, with columns for Payment No, Type, Tip, CC Service Charge, Amount, Status, Auth Code and Transaction No.
Related Articles
Retail Back Office: Item Sale History Report
Navigation: Log into the Back Office for your Retail Store, then select Reports > Item Sale History The Customer Item History report page includes all individual item sale details for the selected Time Period. Select the Item Name. You can Search for ...Retail Back Office: Exchange Reports
Navigation: Log in to the Back Office for your Retail Store, then select Reports > Exchange The Exchange Report page that appears will display Today's data by default, but you can select a Time Period from the dropdown and select any Date(s) if ...Retail Back Office: Enterprise - Reports
Navigation: Sign into the Back Office. On the left-side Navigation Panel, click Enterprise. Select Enterprise Reports, and the dropdown contains options to access specific reporting Dashboards: Enterprise Reports Sale Report The Sale Report dashboard ...Retail Back Office: Employee Reports
Navigation: Sign into the Back Office and select a Retail Store, then select Reports > Employee The Employee Reports page displays a comprehensive set of data on the activity of the Store's employees, with tabs for the following: Attendance Role ...Retail Back Office: Revenue Center Reports
Navigation: Log into the Back Office for your Retail Store, then select Reports > Revenue Center The Revenue Center Reports page is used to organize all the different transactions at the Retail Store based on the POS Node (which are defined in ...