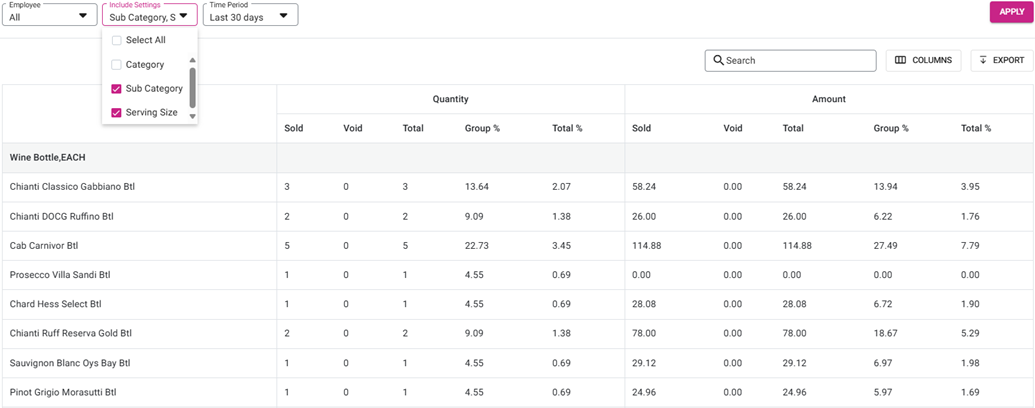
Items: The item’s category, subcategory and serving size.
Quantity: Sub headers for amounts Sold (quantity), Void (quantity), Total (Sold Quantity + Void Quantity), Group % and Total %.
Amount: Sub headers of the amounts Sold (in currency), Void (in currency), Total (Sold Amount + Void Amount), Group % (Item Total / Group Total) and Total % (Item Total / Grand Total [at the very bottom]).
The overall Total appears for the Quantity and Amount of each Category, Sub-Category and Serving Size.
The Grand Total appears at the very bottom of the table for all columns.

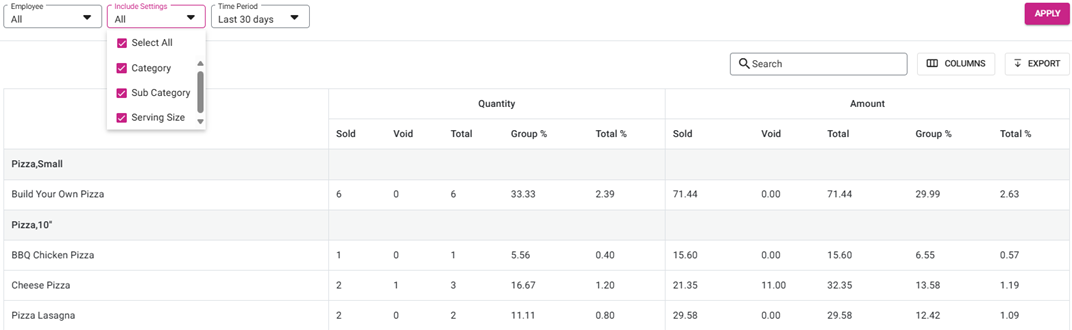
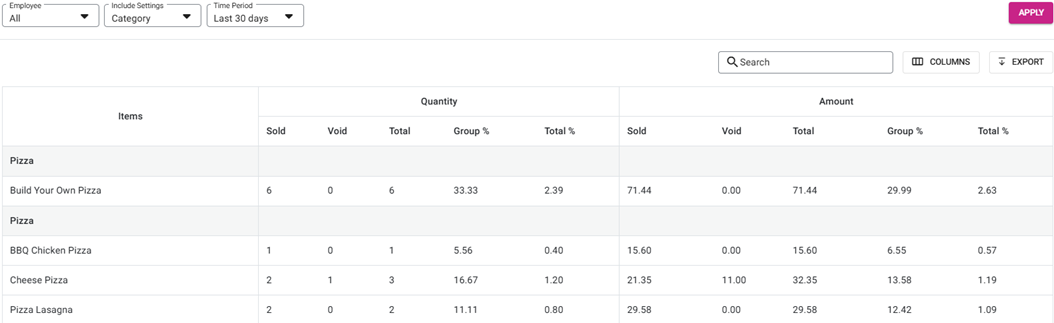
Note: The organization of the table will be broken down by the Items column depending upon the Include Settings selections:
Example: When Select All (Category, Sub Category and Serving Size) is selected:
- Example: When just Category is selected:
- Example: When Sub Category and Serving Size are selected